Categories
Front-end Development JavaScript

Deep Copying Objects in JavaScript: An In-Depth Look at structuredClone()

Reading Time: 2 minutes

One of the common sources of issues in JS applications is not having a firm foundation in core concepts. With this post, I’ll cover one of the ways to deep copy Objects.

JavaScript objects are passed by reference and not by value, meaning that when you copy an object, you are copying a reference to the original object, not the object itself. To overcome this, we can use a method called structuredClone(). In this blog post, we’ll explore what structuredClone() is, how it works, its pros and cons, and some examples of how to use it.

What is structuredClone()?

structuredClone() is a method used to copy an object in JavaScript. It’s a deep copy, meaning that all properties of the original object and its nested objects are copied to a new object. Unlike shallow copying methods such as Object.assign() and the spread operator (...), structuredClone() can handle circular references, functions, and other complex data types.

How does structuredClone() work?

structuredClone() works by creating a new instance of the original object and copying all its properties to the new instance. This process continues recursively for any nested objects in the original object.

Pros of structuredClone():

  1. Deep copying: structuredClone() creates a deep copy of an object, meaning that any changes made to the copied object will not affect the original object.
  2. Handling of complex data types: structuredClone() can handle circular references, functions, and other complex data types that other copying methods cannot.
  3. Better performance: structuredClone() is faster than other deep copying methods, especially for larger objects.

Cons of structuredClone():

  1. Browser compatibility: structuredClone() is only available in certain browsers, such as Google Chrome and Mozilla Firefox. It’s not supported in Internet Explorer or Safari – “structuredClone” | Can I use… Support tables for HTML5, CSS3, etc.
  2. Limited data types: structuredClone() can only handle certain data types, such as objects, arrays, booleans, numbers, strings, and dates.

Example:

const books = [
  {
    title: "Eloquent JavaScript: A Modern Introduction to Programming",
    author: "",
  },
  { title: "JavaScript: The Definitive Guide", author: "David Flanagan" },
];
const booksBackup = structuredClone(books);

books[0].author = "Marijn Haverbeke";

console.log(booksBackup[0].author) // undefined
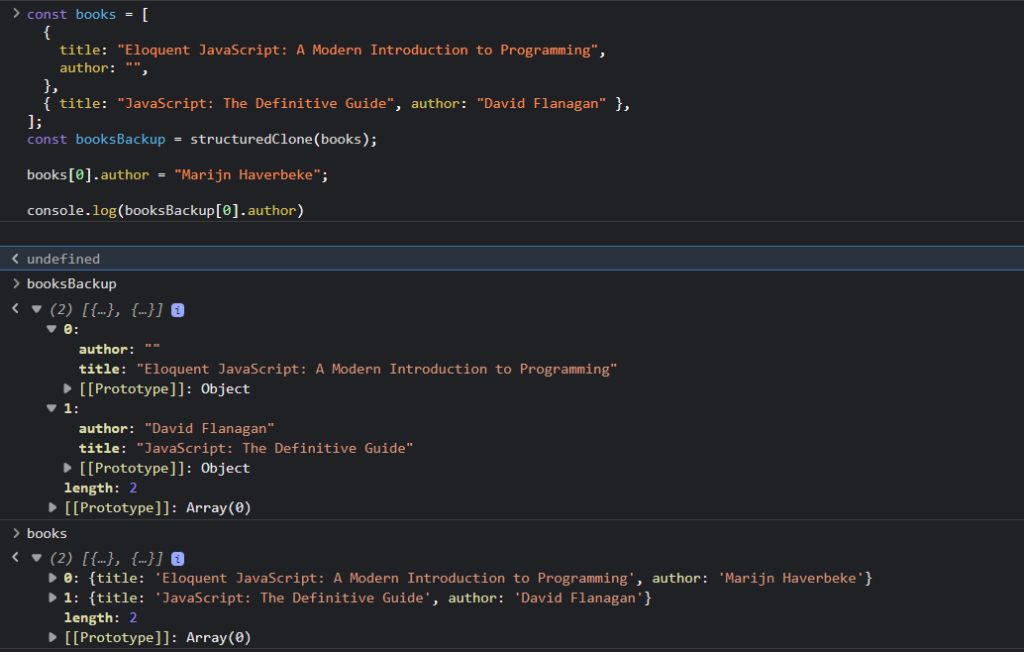
In this example, we can see that despite changing an object in the books array, there’s no impact on the booksBackup. Resulting in the author remaining undefined for the first book.

If you’ve been heavily using JSON.stringify(JSON.parse()), structuredClone() offers a better alternative.

The main difference between JSON.stringify(JSON.parse()) and structuredClone() for copying an object in JavaScript is the way they handle certain data types.

JSON.stringify(JSON.parse()) is a common method for copying an object in JavaScript, but it has some limitations. It only works with data types that can be represented as JSON, such as objects, arrays, booleans, numbers, and strings. It cannot handle functions, dates, or other complex data types.

structuredClone(), on the other hand, is a more robust method for copying objects in JavaScript. It can handle a relatively wider range of data types, including functions, making it a more suitable option for deep copying objects with complex structures.

Categories
Angular Front-end Development

Exploring the Angular DevTools Extension: A Beginner’s Guide

Reading Time: 4 minutes

For debugging an Angular application some prefer debugger, some only know of console.log(), while some use tools such as Angular Augury or Angular DevTools. With this post I’m gonna introduce Angular DevTools.

Angular is a robust framework for building complex web applications. One important tools I prefer for developing and debugging Angular applications is the Angular DevTools extension, which provides a variety of features for inspecting and manipulating an Angular application at runtime. In this blog post, we will explore some of the key elements of the Angular DevTools extension and how they can be used to improve the development process.

First, let’s take a look at the Elements tab, which allows you to inspect the HTML elements of your application and see how they are rendered. You can see the component tree, view the properties and state of each component, and even make changes to the HTML and see the results in real-time. This is particularly useful for debugging layout and styling issues.

Chrome DevTool – Elements Tab

Next, let’s take a look at the Component tab, which provides detailed information about each component in your application. You can see the inputs and outputs, view the component’s lifecycle events, and even trigger change detection manually. This is particularly useful for understanding how a component works and troubleshooting issues related to data binding and change detection.

Angular DevTools Components

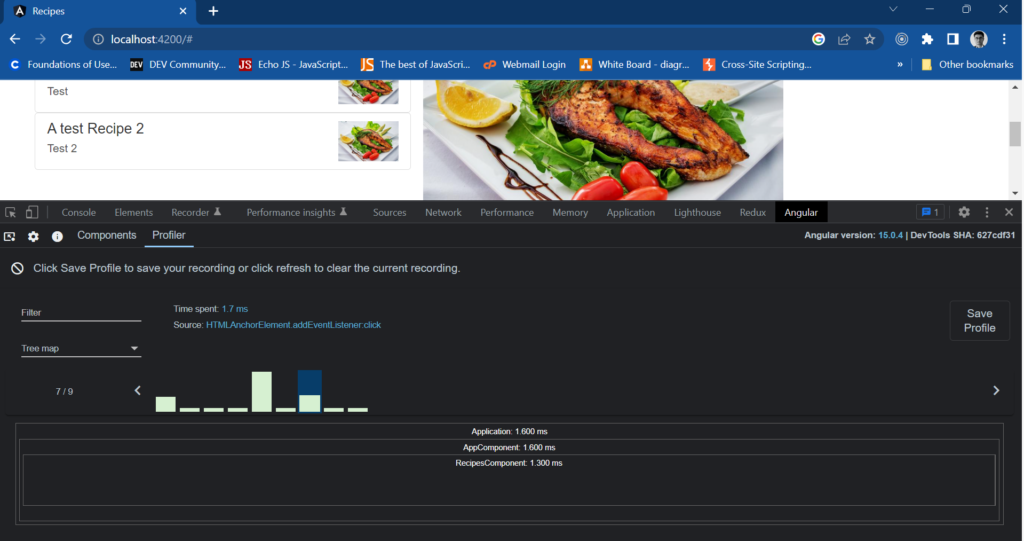
Another useful feature of the Angular DevTools extension is the Profiler tab, which allows you to profile the performance of your application and identify bottlenecks. You can see the time taken by each component to render, view the change detection cycles, and even record a profile of your application and analyze it later. This is particularly useful for optimizing the performance of your application.

In summary, the Angular DevTools extension is a powerful tool for developing and debugging Angular applications. It provides a variety of features for inspecting and manipulating an Angular application at runtime, including the ability to inspect HTML elements, view component information, profile performance, and inspect the state of your application. This extension can help you improve the development process and troubleshoot issues more efficiently.

More on the Components Tab

The Components tab in the Angular DevTools extension provides detailed information about each component in an Angular application. It can be helpful for an Angular developer in the following ways:

  1. Inspecting inputs and outputs: The Components tab allows developers to view the inputs and outputs of a component, which can be helpful in understanding how data is being passed between components and troubleshooting issues related to data binding.
  2. Viewing component lifecycle events: Developers can see the lifecycle events of a component, such as when it is created, updated, or destroyed. This can be helpful for understanding the behavior of a component and troubleshooting issues related to change detection.
  3. Debugging change detection: Developers can manually trigger change detection and view the resulting changes, which can be helpful for troubleshooting issues related to change detection.
  4. Understanding a component’s behavior: Developers can inspect the properties and state of a component and view the resulting HTML, which can be helpful for understanding how a component works and troubleshooting issues related to layout and styling.
  5. Inspecting change: Developers can track the changes in a component, and how they affect the overall application.

Overall, the Components tab in the Angular DevTools extension provides a wealth of information about the components in an Angular application, which can be extremely useful for understanding how a component works and troubleshooting issues related to data binding, change detection, and overall behavior of the component.

More of the Profiler Tab

The Profiler tab in the Angular DevTools extension provides information about the performance of an Angular application. It can be helpful for an Angular developer in the following ways:

  1. Identifying performance bottlenecks: Developers can profile the performance of their application, view the time taken by each component to render, and view the change detection cycles. This can be helpful for identifying performance bottlenecks and optimizing the performance of the application.
  2. Analyzing performance over time: Developers can record a profile of their application and analyze it later, which can be helpful for understanding how the performance of the application changes over time and identifying patterns or trends.
  3. Debugging change detection: Developers can profile the change detection cycles of the application, which can be helpful for troubleshooting issues related to change detection.
  4. Identifying unnecessary re-renders: Developers can inspect the time taken by the component to re-render and find the unnecessary re-renders that might be causing performance issues. Pretty common when change detection strategy is not leveraged correctly.
  5. Identifying the cause of a slow app: Developers can use the profiler to see the call stacks and function calls that are taking the most time and identify the cause of a slow app.

Overall, the Profiler tab in the Angular DevTools extension provides a wealth of information about the performance of an Angular application, which can be extremely useful for identifying performance bottlenecks, understanding how the performance of the application changes over time, and troubleshooting issues related to change detection and unnecessary re-renders. This information can help developers improve the performance of their applications and provide a better user experience.

If you found this blog helpful, don’t hesitate to drop a comment. Thanks.